Getting Started with the Connector for Episerver
The Connector supports all web browsers that Episerver supports. The Connector supports Episerver versions 10 and 11.
To access the Connector:
-
Log into Episerver.
-
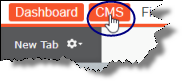
In the top-left corner, click CMS.
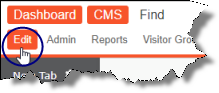
- In the menu that opens, click Edit.
- In the top-right corner, click the Toggle assets pane folder icon.
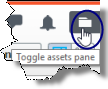
The Assets pane opens.
- If the Lionbridge Connector gadget is collapsed, click it to expand it.
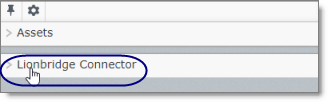
The Lionbridge Connector gadget opens. It contains basic Connector functionality, including creating a translation project. For a detailed description of the gadget, see The Connector at a Glance.
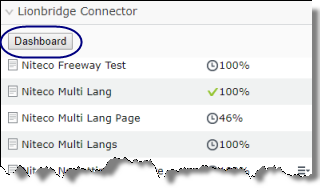
- Optional. Do one of the following to open the Lionbridge Connector Dashboard (“Dashboard”), which has enhanced Connector functionality:
-
Click the Dashboard button near the top of the gadget.
-
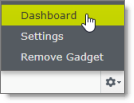
In the bottom-right corner of the gadget, click the Settings icon  , and then select Dashboard from the context menu.
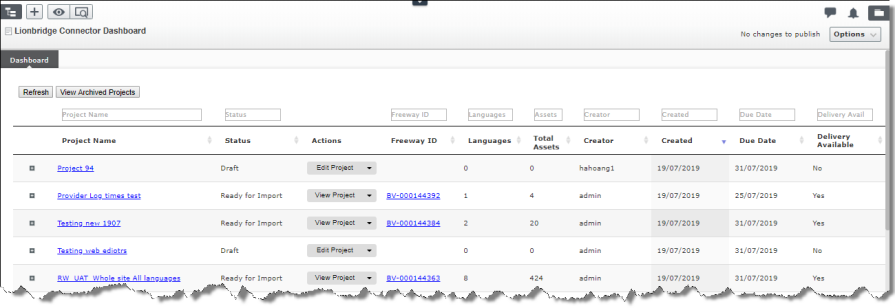
The Lionbridge Connector Dashboard opens in the system workspace. For a detailed description of the Dashboard, see Monitoring Translation Projects.
Tip: Click the Pin icon  to keep the Lionbridge Connector open by default in future sessions.
1 - The Connector at a Glance
The Lionbridge Connector for Episerver has two main interfaces:
Lionbridge Connector Gadget
View screen capture
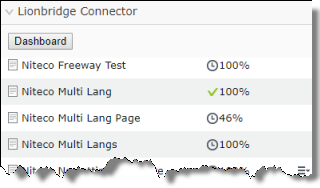
The gadget displays the following information about each translation project:
- name
- status
- percentage complete
The gadget also includes the following Connector functionality, which is available from the context menu for each displayed translation project:
- creating a project
- editing a project
- sending out a project for translation
- importing translated content into Episerver
- publishing translated assets
- canceling a project
- removing a project from the Connector
For detailed information about the gadget, see Viewing Your Translation Status Summary.
Lionbridge Connector Dashboard
View screen capture
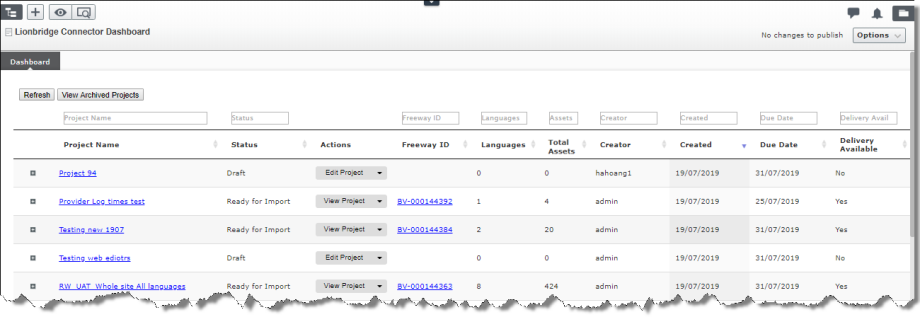
The Dashboard includes the following Connector functionality:
- displaying detailed translation-status information about projects
- filtering the projects displayed in the Dashboard
- sending out a project for translation
- viewing archived projects
- viewing unarchived projects
- viewing a project
- editing a project
- canceling a project
- importing all available translated content in the project into Episerver
- importing translated content in the project into Episerver for individual target languages
- viewing translated assets
- publishing all available imported translated assets in the project
- publishing imported translated assets in the project for individual target languages
- archiving a project
- unarchiving a project
- removing a project from the Connector
Note: You can create a new project only in the Lionbridge Connector gadget.
For detailed information about the Dashboard, see Monitoring Translation Projects.